Debugging NiM


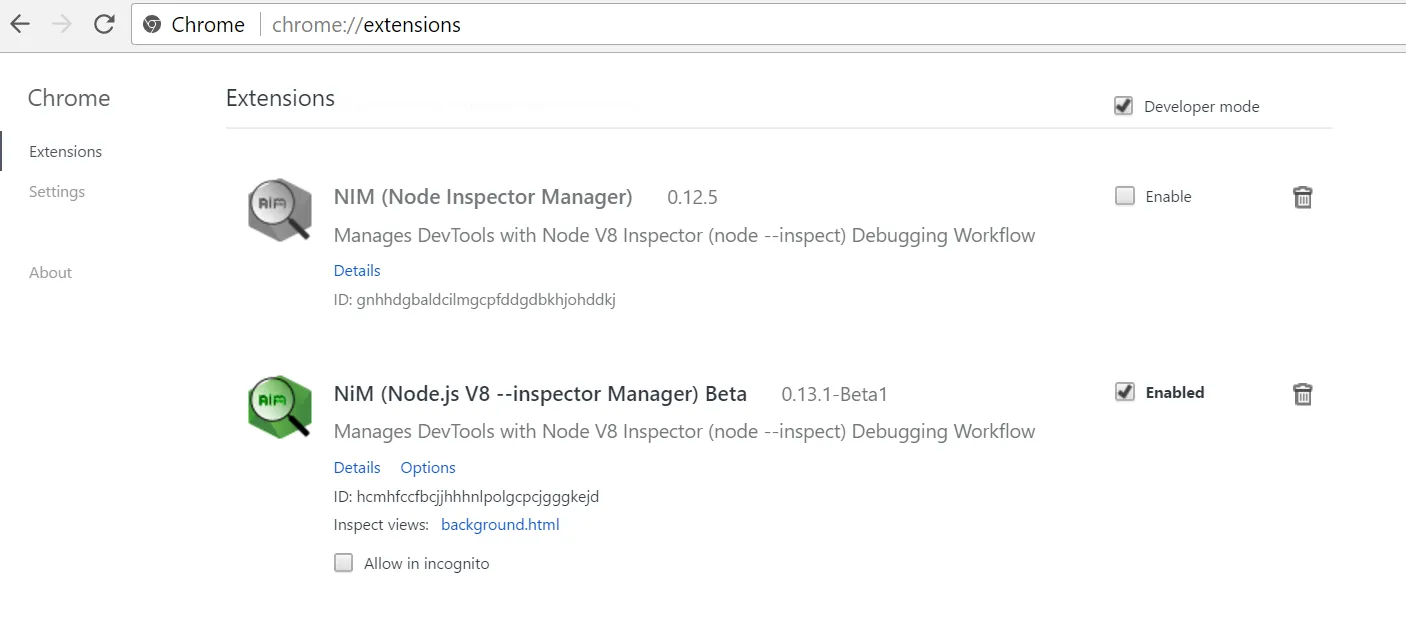
- Set "Developer mode" by checking the "Developer mode" checkbox at the chrome://extensions page
- Now go to the NiM extension item on the same page (you may have to scroll down if you have lots of extensions installed) and you should now see the background.html link
Inspect views: background.html.
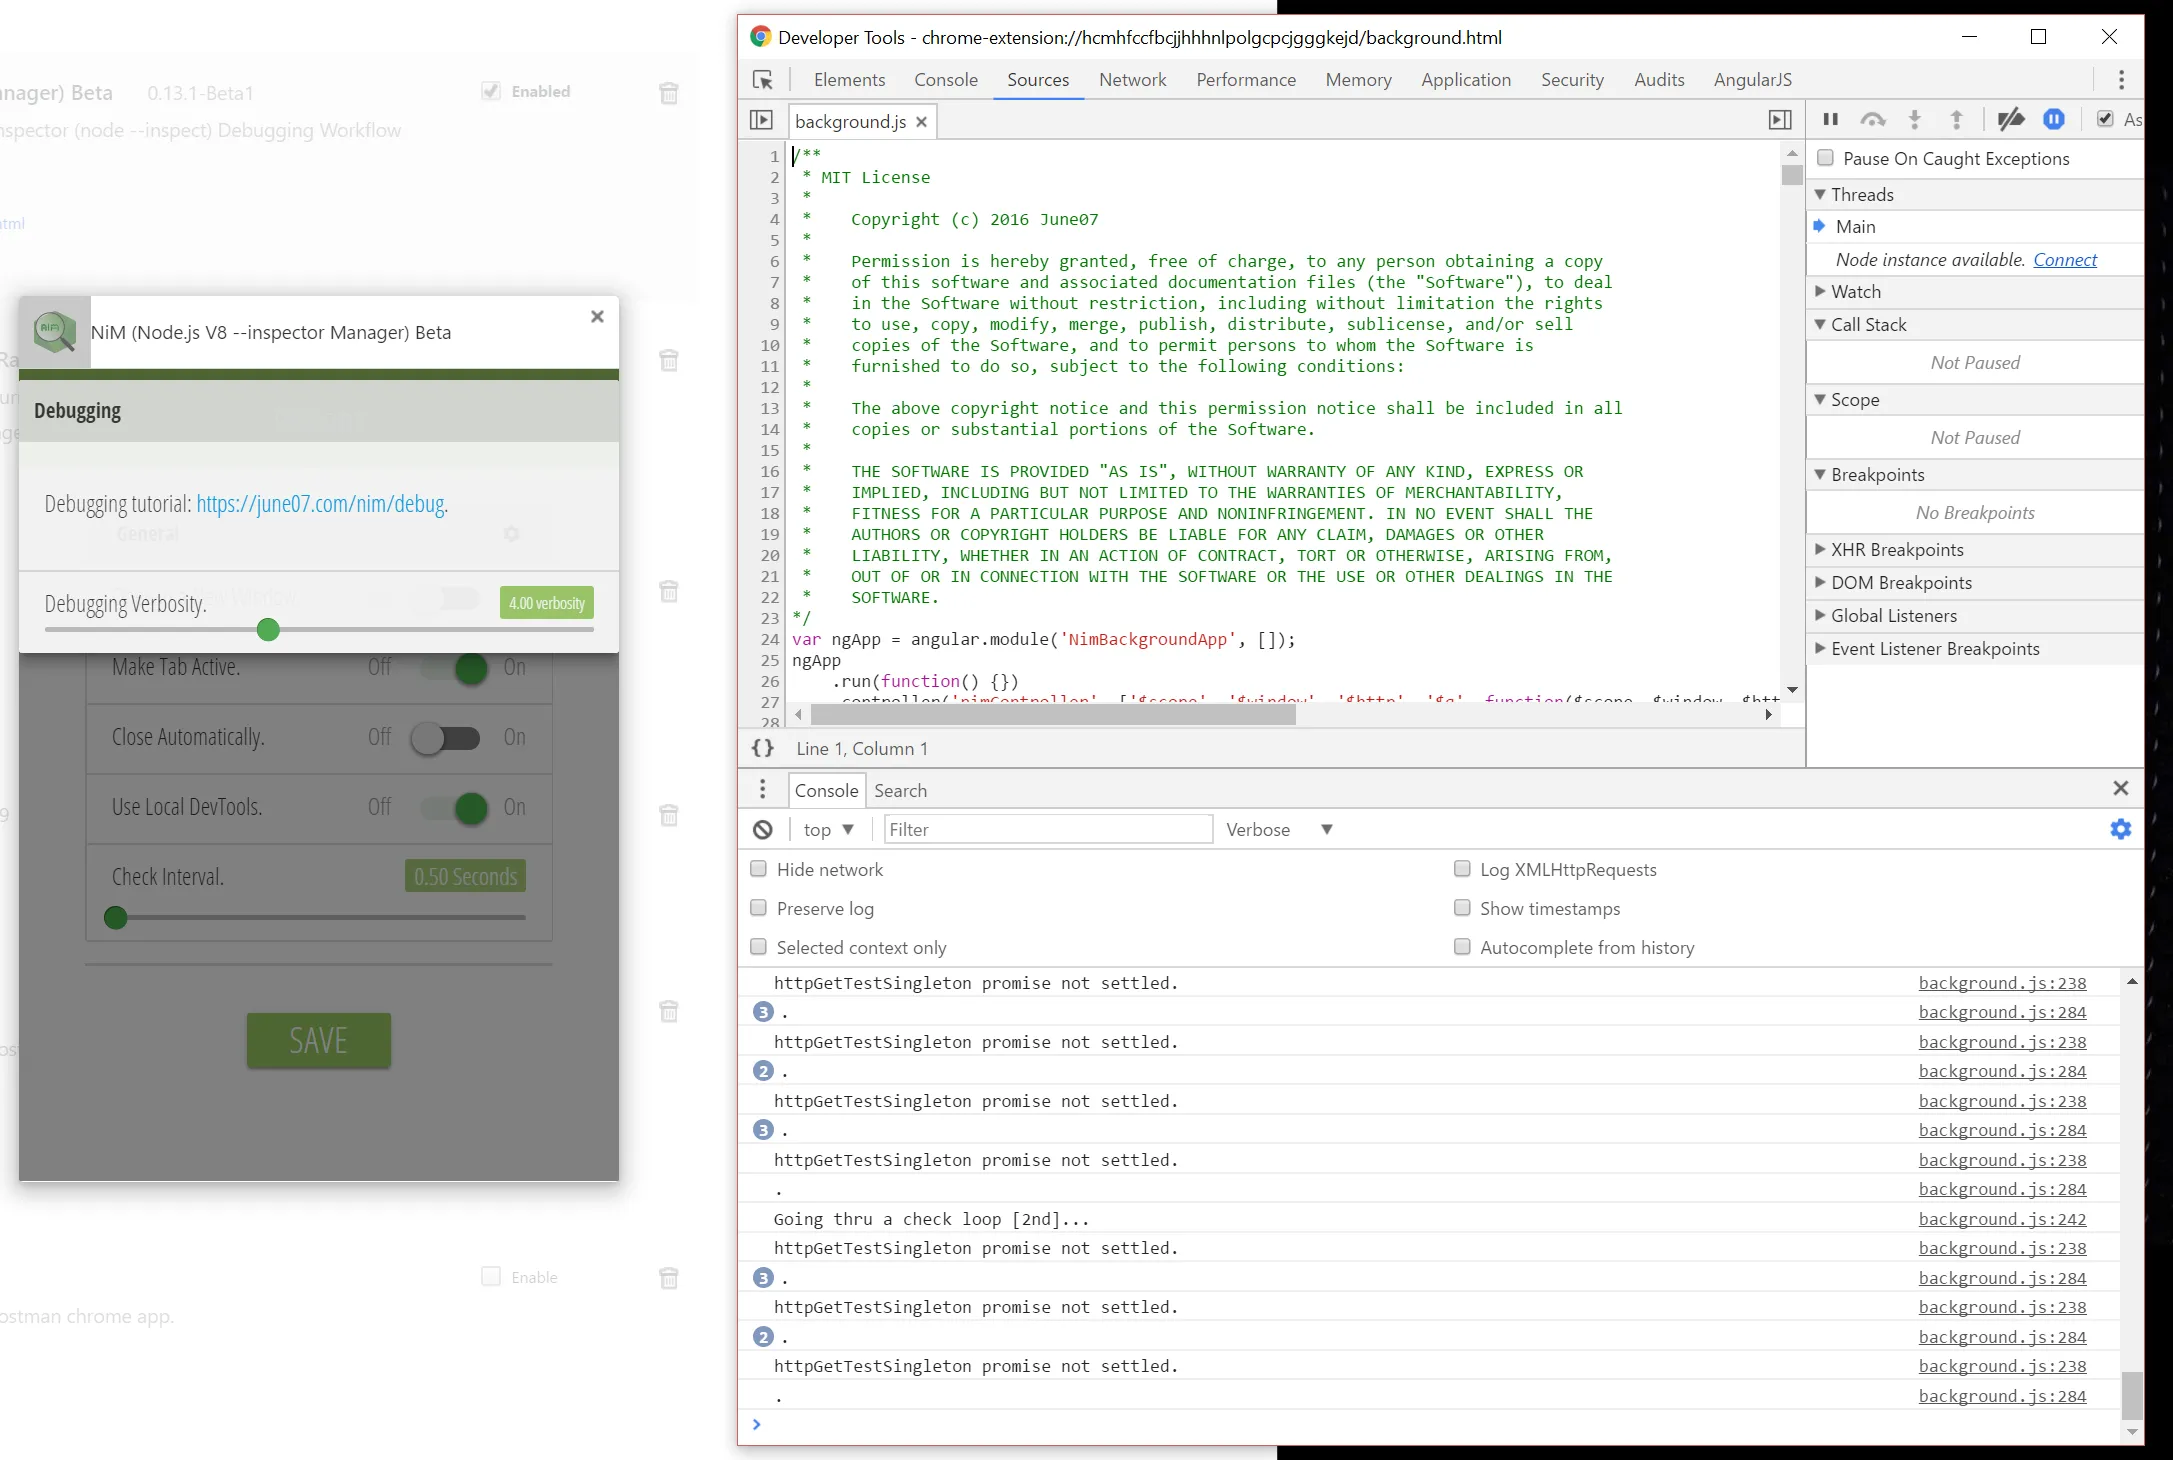
- Once you click on that link, a Developer Tools window will open up wherein you can use the DevTools Console to see logging messages. Logging verbosity can be controlled via the "Debugging Verbosity" setting in NiM as shown: