Inspect Broke My Workflow!


A few months ago I began using the built in Node V8 Inspector in lieu of node-inspector. My personal choice for switching came out of sticking to the path of least resistance, and for me, that entails keeping tooling as minimal as possible. Metaphorically speaking, the prospect of having one less hammer to carry around (more like keep track of) on the job-site was a welcome one. Like so many other Javascript developers nowadays, I find it overwhelming having to sort through all of the combinations and permutations of the many tools and methods of doing the work that needs to be done. Currently, a Google search turns up 1.5 million results on "javascript debugging tools" alone, and that only covers debugging. Drop the word "debugging", re-run the search, and you may find your jaw drop as well!
So as my favorite Food Network chef, Alton Brown is often making an argument for, I felt obliged to get rid of another "unitasker" (to be fair a pretty generic term, yet one I like to attribute Alton Brown credit)
So upon discovery of the Node.js project integrating V8 inspector support, making the switch was a very simple decision. For those interested, the history of this change can be found at this GitHub link. Note the first part of aforementioned GitHub link, "For background see: #2546 (comment)" if you want to read in depth on the subject.
Before the switch from node-inspector to the built in Node V8 Inspector, my workflow was something similar to:
Phase - Setup
- After installing node-inspector, start it in one terminal.
- In another terminal, run nodemon --debug myapp.js.
- Open the node-inspector URL in Google Chrome
(iehttp://127.0.0.1:8080/debug?port=5858).
Phase - Rinse & Repeat
- Edit code.
- Debug.
- Repeat steps 1 and 2.
And my goal in switching from node-inspector was to eliminate step 1. of the setup phase:
From this Setup...
1. ~~After installing node-inspector, start it in one terminal.~~2. ~~In another terminal, run nodemon --debug myapp.js.~~
3. Open the node-inspector URL in Google Chrome...
To this!
1. Run nodemon --inspect --debug myapp.js.2. Open the node-inspector URL in Google Chrome...
Alas, the built in Node V8 Inspector's behavior was slightly different from node-inspect. Instead of the usual
http://127.0.0.1:8080/debug?port=5858
node was giving me a link like
chrome-devtools://devtools/remote/serve_file/@60cd6e859b9f557d2312f5bf532f6aec5f284980/inspector.html?experiments=true&v8only=true&ws=localhost:9229/06532437-10b8-4109-ba6c-c6a1625c741a
which in and of itself doesn't seem like a problem right? Well, it turned out that with every code change (and thus reload triggered by Nodemon), Node would return a different web socket UUID in the link.
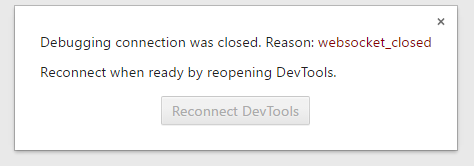
So using that nice "Reconnect DevTools" button wasn't even an option. Rather, the new URL given by node had to be copied from the terminal and pasted into the browser on each restart of the Node process (i.e. code edit). The result was a "Rinse & Repeat" workflow which instead of 3 steps was now 4:
- Edit code.
- Copy and paste URL from terminal to browser. (The unwelcome additional step!)
- Debug.
- Repeat steps 1, 2 and 3.
Curious as to why the UUID had been added, I did a little bit of searching and found the answer.
Create a unique v8_inspector WebSocket address: Generate a UUID for each execution of the inspector. This provides additional security to prevent unauthorized clients from connecting to the Node.js process via the v8_inspector port when running with --inspect. Since the debugging protocol allows extensive access to the internals of a running process, and the execution of arbitrary code, it is important to limit connections to authorized tools only. Note that the v8_inspector protocol in Node.js is still considered an experimental feature. Vulnerability originally reported by Jann Horn. [1]
Great so the change was made to add security where a possible attacker could gain access to systems by simply attaching to a well-known port. Adding the UUID "secret" thus makes it impossible to communicate with the debugging protocol without knowing said secret. At this point, I thought, okay so that's all fine and good but couldn't any potential attacker just connect to the JSON info URL (e.g. http://localhost:9229/json) to retrieve the secret UUID?! After a bit of confusion, coffee, and a few emails I got more insight into what was going on. Thank you to Eugene at Google for the quick reply to my inquiry:
This is to prevent malicious web pages from doing attacks through the Node debug interface. Browser security model allows for cross-origin WebSocket connections but not for HTTP requests. So malicious web page would not be able to discover the UIID from /JSON/list.
So this means that a malicious site could not access our secret UUID because the browser security would block such attempts. Which only leaves direct access to the JSON URL open, in which case you should have proper safeguards (e.g. firewall, listening on localhost only, etc) in place to protect against attacks via these avenues.
With this new found knowledge, I felt a lot better while using the Node V8 Inspector! Unfortunately, I was still left with a broken workflow, because there was this UUID (albeit well-intended one) in my way...
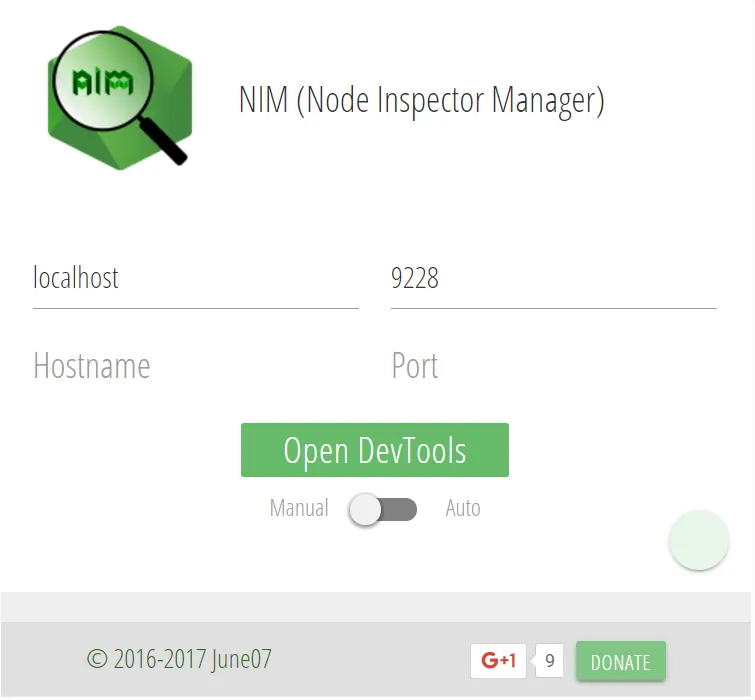
NIM to the Rescue!
First of all, for those of you who prefer to learn by doing, or maybe who are just tired of reading this post. You can view NIM in the Chrome Web Store or install it now.
And here's a QUICK (about 15 second) YouTube tutorial. I highly recommend you full screen it as the text is very small otherwise!
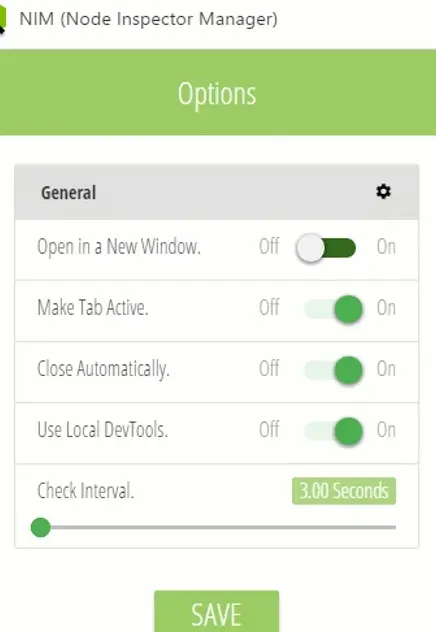
Now let's get into explaining exactly what NIM does, and how it helped me fix my workflow using node --inspect. In short, NIM manages the interaction between you and Chrome DevTools, eliminating any tedious manual stages of that interaction including copying/pasting, opening/closing tabs or windows. It does this by as we mentioned earlier, visiting the JSON information URL and extracting that secret UUID value. It then connects the pieces for you and responds in whatever way you have configured it to. The current available options are shown in the GIF below:
So ultimately by both switching to the built in Node V8 Inspector and leveraging the NIM Chrome Extension, I was able to streamline my workflow practically eliminating the setup phase entirely (just start the node process).
New and Improved Workflow
- Run nodemon --debug myapp.js.
- Edit code.
- Debug.
(Repeat steps 1 and 2)
Hopefully you can use this post to fix your own broken workflow.