NiM with Tabs for 2019!
NiM inspect multiple Node.js debug sessions.


Finally pushed what I hope is a solid solution and it comes in the form of a tabbed interface:
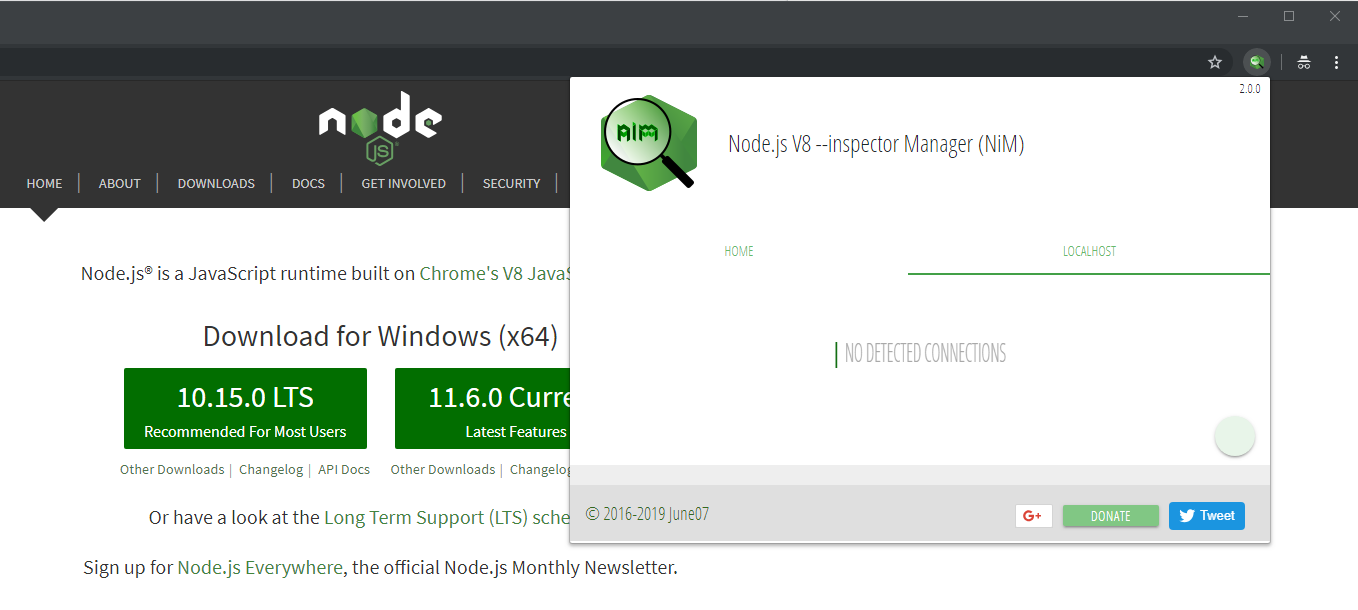
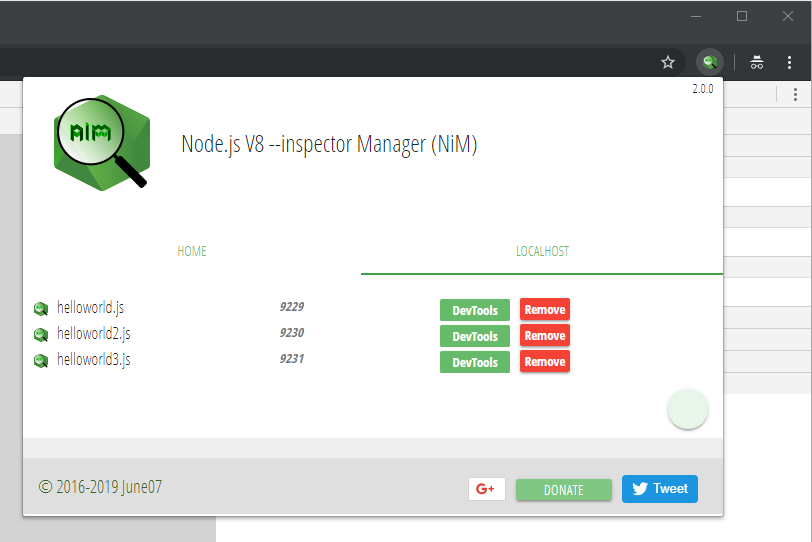
The home tab houses the normal interface you're used to while the "LOCALHOST" tab will display all active Node.js debug sessions. Say you are debugging 3 helloworld programs, because after all helloworld.js demands that type of analysis. It would look like this:
Brief History
Since March 2018 Visual Studio Code has had the auto attach feature while debugging Node.js code. Yet, this feature has been available via Chrome DevTools with the NiM chromium extension (and open source NiM on GitHub) since late 2016. The request for NiM to manage multiple debug sessions has been around since almost the beginning.
What is Auto Attachment?
If enabled, Chrome DevTools with automatically attach to Node.js processes either started with the --inspect flag or otherwise put into debug mode via the SIGUSR feature This simple mechanism smoothes the debugging workflow tremendously assuming you're using Chrome DevTools and Node.js --inspect.
Why multiple sessions?
The need to utilize more than a single debugging session arrises quickly when one begins working on distributed systems where multiple Node.js processes are communicating with one another. The ability to inspect what's happening at both ends of the connection is super helpful. The more debug points you're working with at once, the more complexity increases, so obviously the less you have to do to manage that complexity the better as it allows you to focus on the code and less on the debugger.