Inspect Node.js With Grunt-SWATCH (!watch) And Fiveo

I know, I know... the socket in the cover picture isn't really the type of socket we're talking about in this post, but I've been preoccupied lately with the idea of building a new workstation and the ThreadRipper is a monster! I mean it might actually be the solution to never feeling like my computer is never fast enough no matter what I upgrade to using (right now it's an Intel I7 8th Gen CPU). Every desktop/workstation I've ever used over the years (well there was one) has always left a lot to be desired. Waiting on your computer to COMPUTE sucks! Screen glitches, seemingly never ending progress spinners, lag time, and the like really break up productivity and workflow. Anyway on to the topic and away from the...

NodeBB (Node.js Forum) Hacking
As I've written about recently, my hacking time of late has been spent on the forum software NodeBB. The build process that the developers of NodeBB put into place relies on the Grunt task runner, which itself is also build with Node.js. It's great when you can work within an ecosystem built primarily upon the frameworks you enjoy the most (for example Node.js) However when it comes to debugging, and when your build tooling and other layers of software are all built with Node.js, sometimes things get a little tricky. Like when you want to pass the --inspect flag to node executable to start a debugging session, having the intent of debugging your plugin code, and not the layers above it (Grunt, NodeBB). I am not aware of any command line options specific to the Grunt cli that can be used to pass your intent to start a Node debugging session down to the task level. I tried several things to no avail, however there were still a few options to get it done:
- Start Grunt by calling Node directly, ala
node --inspect /path/to/grunt - Start the Node Inspector programmatically using the still experimental Inspector API
- Start the Node Inspector after the fact using Linux signals,
SIGUSR1to be exact.
Tradeoffs
Of course, each of these solutions provided obstacles of there own, and as with most things included both positive and negative aspects! In this post I'll talk about each of these solutions, detailing the issues I faced using each one. We will see how leveraging the Inspector API made the NPM module fiveo possible, and how that tool makes using Linux signals with Node.js even more powerful. And finally I will show how in the scenario presented herein, option #3 proved to be the best solution. And how choosing option #3 served as a catalyst to write the grunt-swatch plugin, what that plugin currently does, and what it could do with a little more work.
1. The Inspect Flag --inspect
So this command works perfectly well to start the debugger:
node --inspect /home/batman/.nvm/versions/node/v10.16.0/bin/grunt
and grunt will continue doing it's thing which is to perform a bunch of build steps before actually starting the NodeBB server. Yet, note the important fact that starting that initial Node process by calling node with --inspect is going to present it's own challenges when Grunt launches entirely new processes. Wonderfully when node child processes are started and the parent process has been called with the inspect flag set, the children will inherit that setting. But it's for that same reason that if you call node with --inspect as we did, you are faced with these nice messages ? staring at you in the console:
failed: address already in use

Those failed: address already in use messages occur because the inspector, which is a socket server, has already been started on the parent process which in our case is Grunt. Thus when the children start with the inherited --inspect flag who's default arguments are set to localhost:9229, Node tries to start up the inspector socket server (we'll call it the "inspect process" from now on) using the default port 9229. A workaround for this would be to change our initial command to:
node --inspect=0 /home/batman/.nvm/versions/node/v10.16.0/bin/grunt
The "=0" causes the inspect process to choose a random port, as you can see 39380 and 46704 have been choosen.

Which is great because now we have two inspector processes running! The part that is not so great is that we don't care about either of them... yet.
NodeBB's Build Setup
I can't completely explain the WHY of the Grunt flow that makes up NodeBB's Gruntfile:

But I can say that WHAT it is doing is basically forking an initialization sequence which takes care of building the css, language files, templates, building/bundling Javascript, etc... and then a second process is being forked to actually start the NodeBB server with assets ready and good to go. Going further, each time a change is detected thanks to the watch process (grunt-contrib-watch), the current NodeBB process is killed and new one started. And with that new process comes... exactly, a new random debug port is going to be generated upon each cycle. Which again complicates our debugging efforts and raises a few questions.
- How do we keep track of all of these random inspector ports?
- Further as we are working on a remote server, how do we handle port forwarding?
- Do we really care about the intermediate inspector sessions?
While we ponder ? on those, let's fork ourselves to...
2. Use Node's Inspector API
Doing so requires a more "invasive" approach when it comes to our initial desire to debug OUR own code. This option requires the inclusion of the inspector module, which in and of itself isn't a big deal. We require code all the time and the inspector module is a core Node.js module, and not some 3rd party piece of code. But, for that module to really be of any use, additional code must be written and added to our codebase.
const inspector = require('inspector')
To be quite...
stepped away to hack on some other code...
Last Night!
So last night while I was writing this, I was starting to write that to be quite honest, I hadn't given the inspector module much of a look before. And while doing so in the effort to write this post in the most informed manner possible, I was sent down a bit of a rabbit hole. One of which I emerged having written a tiny library that adds some sugar on top of the core inspector module, which as it turns out is pretty cool. Now, after having written said tiny library, I would recommend that instead of requiring the inspector module, one would be better off using fiveo which in turn does that for you, while adding some nifty features such as using a port other than 9229 sort of like this GitHub issue is about.

Still, you may not like my tiny library ?, and you may be uninterested in writing your own. The fact that using the inspector api requires adding additional code to your own still exists. And that might be a factor which makes this second option a bad choice for your project. Which leads us to the 3rd and final option...
3. SIGUSR1... Wait I Mean SIGUSR2!
So ultimately the best solution I found was to use UNIX/Linux signals. That's a link to the manpage which gives you an overview of what signals are exactly. The long and short of it is that signals can change the behavior of processes that receive them. Note that signals are not supported on Windows. And from Node's official docs:
Node.js will also start listening for debugging messages if it receives a SIGUSR1 signal. (SIGUSR1 is not available on Windows.)
The Plan
The overall idea is that we can deliver the SIGUSR1 signal to the Node process specific to our code at the time we need it, and not before then, thus eliminating all the noise that we don't care about. Noise like what NodeBB is doing during the init phase (remember it forks a bunch of stuff), or what the Grunt code is getting into, etc. The point that we're ready to start the debugger is the point after Grunt does it's init tasks, starts the NodeBB server, and the forum can be reached via the port it's configured to run on tcp/45670. At that time we need to determine the process id that NodeBB is listening on, because we need a process id in order to deliver our signal to the appropriate place. Upon receiving the SIGUSR1, Node will start the inspector process and we can begin debugging!
What we just described in the preceeding paragraph is exactly what our Grunt plugin grunt-swatch does. It's similar to grunt-contrib-watch in that it continuously watches for changes in your environment, the difference is in that grunt-swatch doesn't watch the filesystem but rather the network, thus the name, derived from socket watch.
grunt-contrib-watch
Run predefined tasks whenever watched file patterns are added, changed or deleted
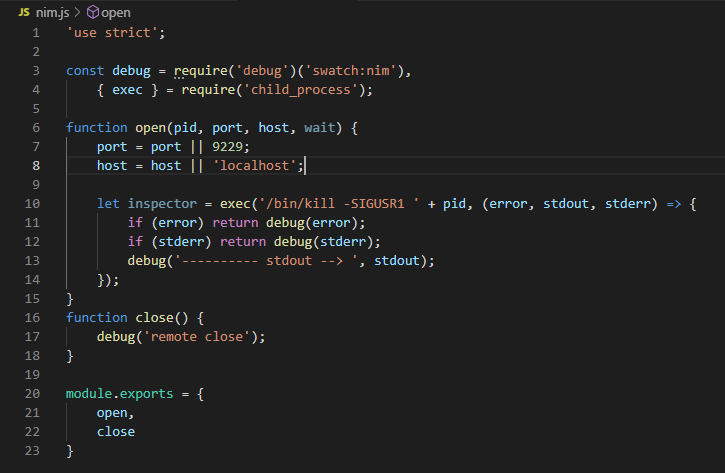
One should be able to write other "actions" for the plugin, however I've only written the nim (aptly named but also a callback to NiM) action nim.js:

You can see that it's rather simple in what it does, but exactly what we need. It uses the Linux kill command (also an entertaining Sci-Fi by the way!) to send the SIGUSR1 signal to our swatched process. As you can see the close() function currently doesn't do anything and that's because prior to writing fiveo, there was no way to close the Node inspector via the signal method. However with fiveo included, we have access to SIGUSR2 which can close the inspector process... leaving things a bit more tidy ?.

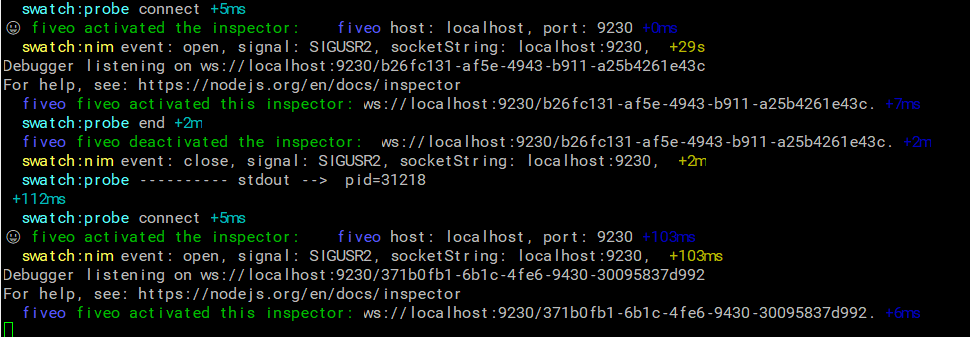
And here is the output where you can see from the swatch:nim log output, that the nim action is actually closing the Node inspector socket that was previously opened. In the screenshot below you can see the complete open/close cycle of this websocket: ws://localhost:9230/b26fc131-af5e-4943-b911-a25b4261e43c

Grunt with my grunt-swatch task loaded and configured appropriately will ensure that during my development process, the inspector will intelligently be stopped and started when I need it to.
grunt.loadNpmTasks('grunt-swatch')
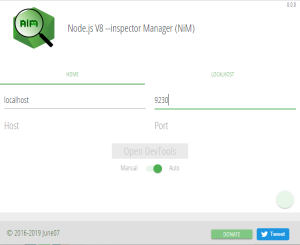
Further NiM will ensure that DevTools is always right where I need it, opened to the correct inspector websocket and ready to go.
And there we have it. By using grunt-swatch, fiveo, along with NiM, our NodeBB plugin development workflow is greatly improved! I certainly don't miss the manual process of running this command over, and over, ? and over again:
pid=`netstat -lnp|grep 45670|awk 'BEGIN {FS=" "}{print $7}'|cut -f1 -d"/"'`
kill -SIGUSR1 $pid
Some next steps could be to devise a method of communicating to the debugee process in order to change the debugger port dynamically. To be able to set the debug port from the Grunt config and in essence force the Node application to open a debugger on a preconfigured (in development, post runtime) port would be ideal!
Conclusion
I hope you found this post helpful. Here are the relevant links to stuff:
- fiveo - NPM https://www.npmjs.com/package/fiveo, GitHub https://github.com/june07/fiveo
- grunt-swatch - NPM https://www.npmjs.com/package/grunt-swatch, GitHub https://github.com/june07/grunt-swatch
- NiM - Web Store https://june07.com/nim, GitHub https://github.com/june07/NiM
