Superior Debugging with NiM: A Must-Have Tool for Node.js Developers
NiM streamlines the debugging process by automating debugger management and integrating with Chrome DevTools, making debugging more efficient and user-friendly compared to traditional methods.


In this post...
- Why Effective Debugging is Essential 💨
- Traditional Debugging Challenges 💨
- Streamlining Debugging 💨
- Debugging Workflow 💨
- Advantages of Using NiM 💨
Random Javascript Video by WesBOS... because video is cool
Debugging Node.js can be as easy as frontend code
Debugging Node.js applications effectively is vital for any developer. Part of the beauty of Node.js is in the great tooling options it has for debugging. Old school methods like using console.log certainly have their place but even more powerful options are listed right here in Node's documentation . This article focuses on the browser based approach specifically using a superior workflow that leverages NiM (Node.js Inspector Manager) to handle all the fiddly bits about debugging Node.js in the browser. In fact this is a re-introduction into how NiM truly is the UX sugar you need for your development sweet tooth, and how it leverages the exact same browser devtools you are already used to using.
Why Effective Debugging is Essential
Efficient debugging is critical for:
- Rapidly identifying and fixing bugs.
- Understanding the behavior of your code.
- Improving the overall quality and performance of your applications.
Traditional Debugging Challenges
Using Chrome DevTools for debugging Node.js typically involves:
- Typing
about:inspectin your browser. - Clicking "Configure" to set up the debugger.
- Adding the debug IP address and port manually.
That might sound simple, like one, two, three, yet these steps can be tedious and time-consuming, especially when managing multiple debugging instances and/or instances where the debugging socket changes quite frequently. There's also a higher chance of developer error while inputing that critical debugging information during each setup process.
A Quick Start
Launch your V8 process (Node.js in our case but could be Deno or others, Bun for example) using the --inspect flag.
node app.js --inspect
Or via your package management tool (npm, yarn, et.al.)
npm start -- --inspect
yarn test --inspect
Done:
Without the sugary sweetness of NiM one would need to perform some additional steps to get a hold of DevTools. But let's talk more about the much tastier (and yet healthier) way to do it...
Streamlining Debugging
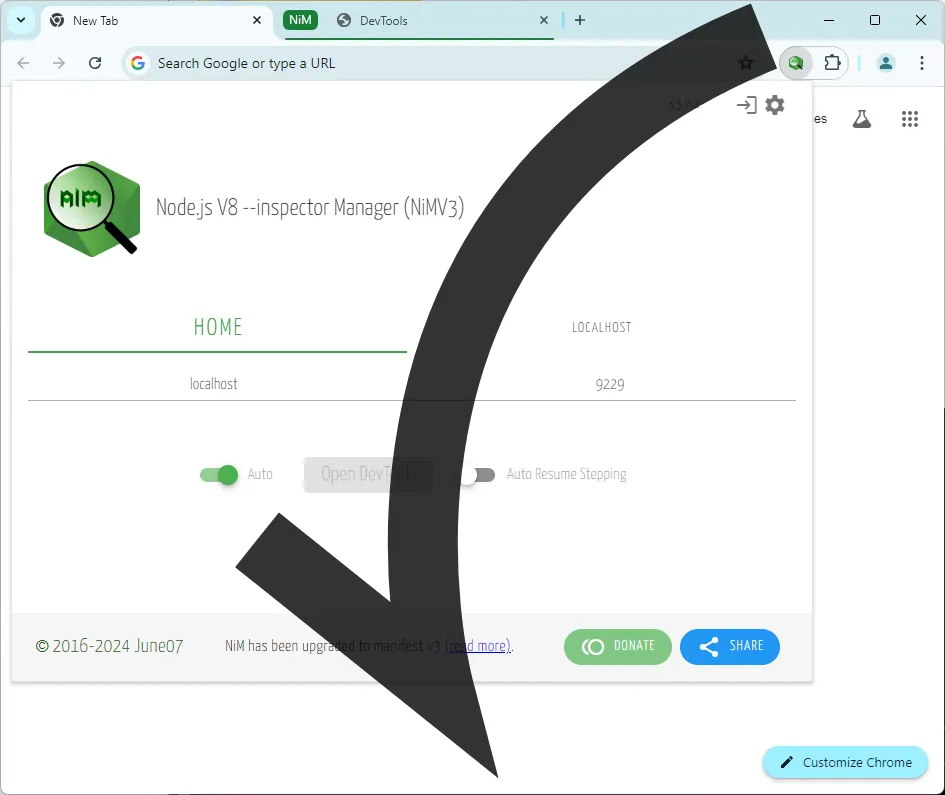
NiM simplifies the debugging process by automating the setup and management of debugger/DevTools instances. And being simply a browser extension, installation is quick, easy, and simply a click away. Here’s how NiM enhances your debugging workflow:
- Automatic Management: NiM detects the URLs generated when running Node.js with the
--inspectoption and manages them automatically. - Effortless Workflow: With NiM, there's no need to manually open and close Chrome DevTools or manage multiple debugger instances.
- Focus on Coding: Spend less time on setup and more time coding, as NiM reduces the overall time spent on debugging configurations.
Debugging Workflow
- Start Your Application with
--inspect: Run your Node.js application with the--inspectflag to enable debugging.
node --inspect app.js
-
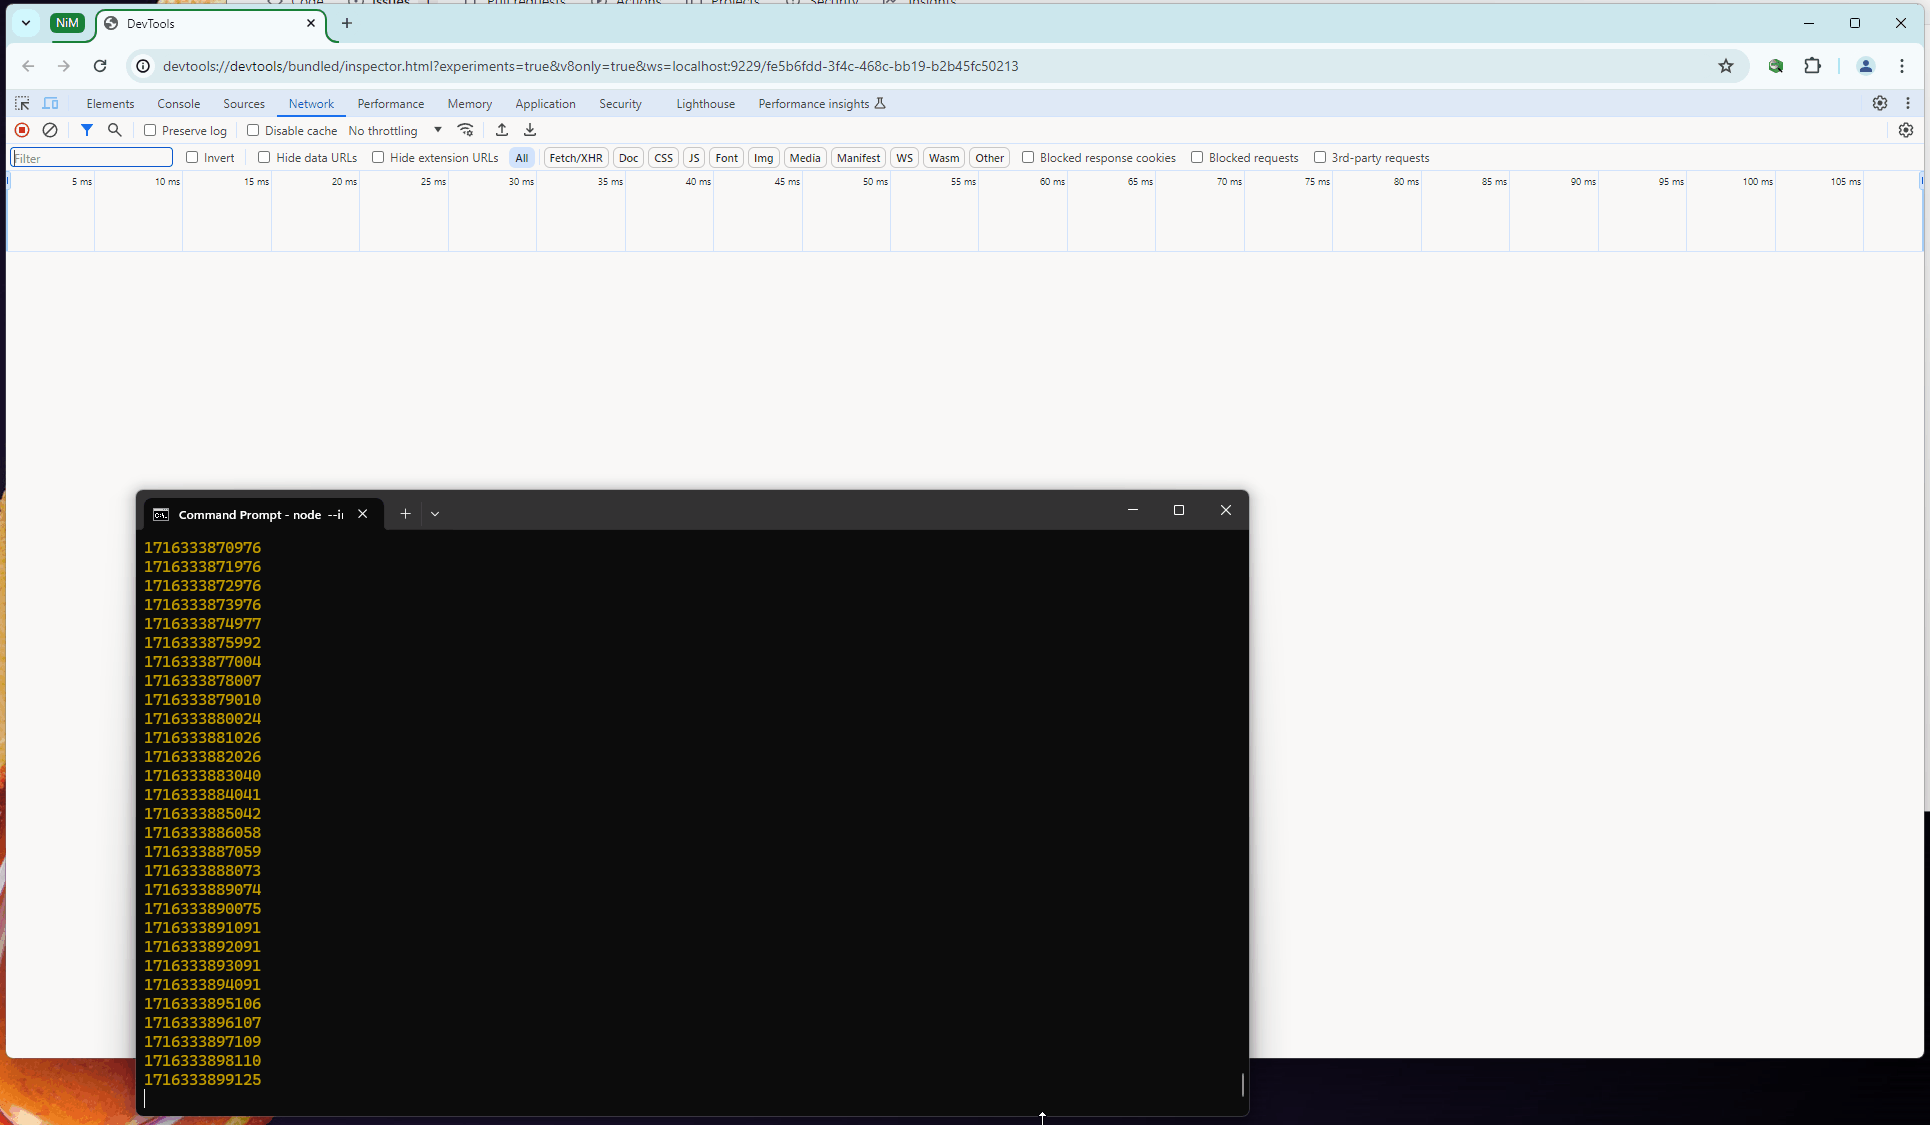
NiM Handles the Rest: NiM will automatically detect the inspection URL and open Chrome DevTools for you. No need to manually navigate to
about:inspector configure settings. -
Set Breakpoints and Debug: Use the Chrome DevTools interface to set breakpoints, step through your code, and inspect variables. NiM seamlessly integrates with DevTools, providing a familiar debugging environment.
-
End Your Session: Once you stop your Node.js application, NiM will automatically close the DevTools window, streamlining the entire process.
Advantages of Using NiM
- Simplicity: NiM automates the setup and teardown of debugging sessions, eliminating the need for manual configurations.
- Efficiency: By managing multiple debugger instances, NiM ensures that you can focus more on coding and less on debugging logistics.
- Consistency: NiM provides a consistent and reliable debugging experience, reducing the chances of missing critical debugging information.
Conclusion
Using NiM for debugging Node.js is the superior approach to debugging and offers a more efficient and streamlined workflow compared to alternative methods. By automating the management of browser DevTools, NiM allows developers to focus on what truly matters—writing and debugging code effectively.
For more detailed information on how to use NiM, you can visit the NiM page on the Chrome Web Store or NiM page on Edge Add-Ons or on GitHub where releases are now available.