Absolute Simplest Node.js Debugging - VSCode/DevTools


In my opinion, debugging Node.js (Node) code hasn't ever been that big of a pain point, largely because of the excellent debugger baked into Node, which has been the case for at least as long as I've been involved with writing software in Node. Python for me is an example of a language I have not spent very much time at all figuring out the intricacies of debugging for, and instead fallback to logging or printing lines like "HERE0, HERE1, HERE2" on every line of code. And I can say with absolute conviction, "that type of work flow sucks!" And compared to a language like Python (at least in my hands), Node debugging just seems easy, and quite frankly the way writing code SHOULD be.
Python: logging.debug('This is a debug message from Python.')
Node.js: console.log('This is a debug message from Node.js')
Debugging Options
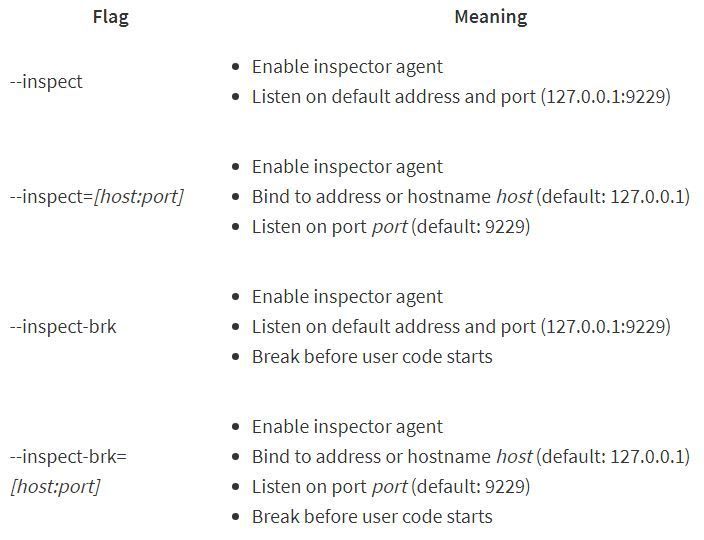
When it comes to first class debugging options (ignoring console.log entirely), there are many options, largely of which are built on top of Node's built in debugger which is in a sense simply a protocol server that's started when you use the --inspect switch (or --inspect-brk or some other form of) when launching the Node executable.
If you're familiar with client/server which I'm sure many are, the Node debugger/debug client paradigm shouldn't be so very hard to to conceptualize or understand at all. Basically the server part is taken care of by the Node code base. That leaves the client side as the only real point where you must make some choices about debugging. And although there are many clients available that speak the V8 debug protocol, I would distill them down to two categories, of which we are going to focus on one in each category, VSCode and Chrome DevTools:
- Chrome Devtools Frontend
- Chromium browsers (Chrome, Edge, ...)
- Other solutions which leverage the Chrome Devtools Frontend code.
- IDE frontends's
- VSCode/Visual Studio
- JetBrains Webstorm
- ...
The debug tools above are basically clients that speak a protocol no different that a browser speaks the HTTP protocol. Yes, there's a lot under the hood like ever changing UUIDs, and WebSockets, but really nothing that should get in the way or complicate debugging your specific application code. The teams charged with designing/implementing the debug protocol have taken care of the detailed bits. Unless you'd like to jump down the V8 protocol rabbit hole instead of your own, you should be able to get by just fine without worrying or being bothered by the detailed inner workings of the V8 debugger and protocol. I would even say that connecting to the debugger protocol and inspecting your code is as easy/simple as connecting to this website (HTTP protocol, http server, http client) and can be done in a matter of minutes... even seconds.
What Are We Going to Do?
In this post I'm going to show you how to debug in VSCode but then to also create shareable URLs which can be used to attach to running debug sessions (your local node.js --inspect process). So for example you could team debug code, or collect debugging analytics, or... If you need a project to test this out with you can download a repo here, otherwise use any code you would like. A few other setup steps are needed including installing the NiMS VSCode extension (https://marketplace.visualstudio.com/items?itemName=June07.nims) which is the bit that generates shareable URLs. Without it you'll still be able to use the Node debugger just fine, you just wont be able to share the share your local debugging sessions with others, without creating a network tunnel or performing some other network configuration magic.
git clone https://github.com/june07/hello.git helloworld
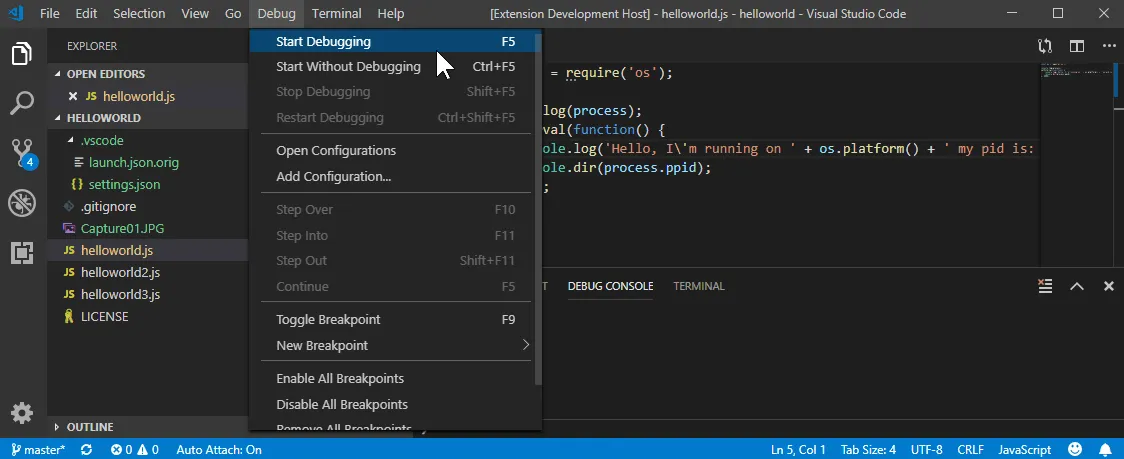
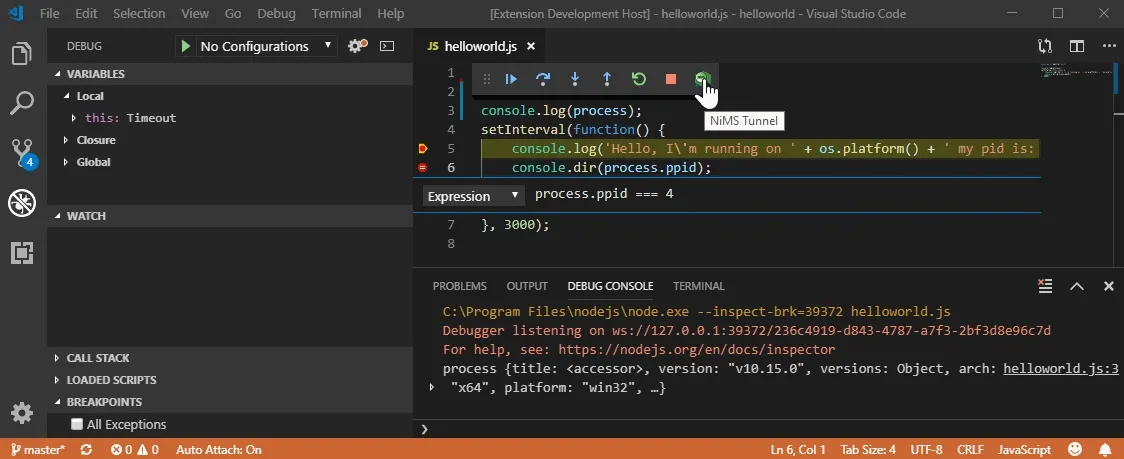
- Open the test directory in VSCode and then open the helloworld.js file in the editor. From the top menu bar click "Debug > Start Debugging" or use the keyboard shortcut by pressing f5 to start the debugger. Once the debugger starts the debugger tool bar will show and allows you to control code execution. You can pause, step over/into/out, restart, and stop the debugger all from the toolbar. Also, this is where you can generate the shareable URLs (assuming you installed the NiMS extension).
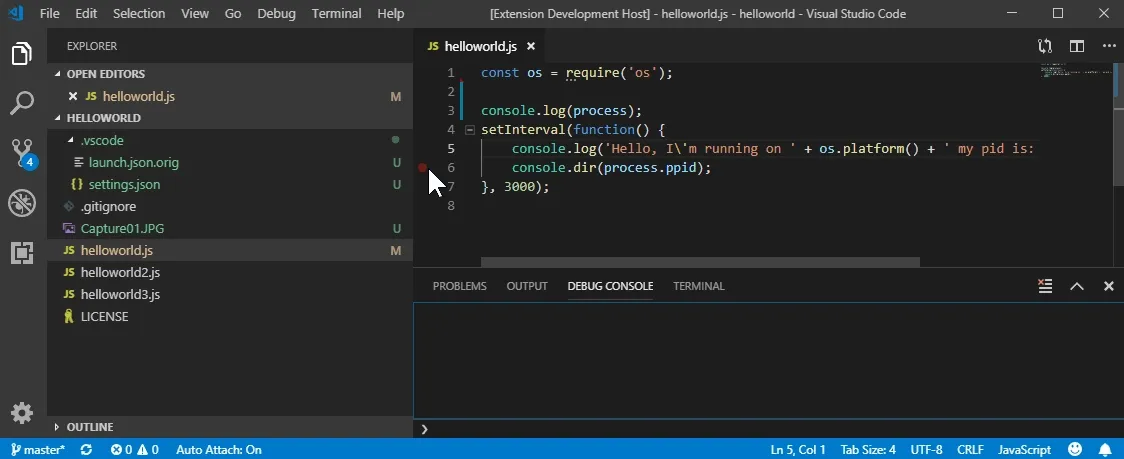
- Breakpoints are where the code execution will pause or "break" and they can be set on the left hand side of the editor as shown. You can also make brake points conditional by right clicking on then and selecting "Edit Breakpoint". In this case the debugger will only stop on my breakpoint if process.ppid === 4. VSCode makes additional functionality available through the "Hit Count" and "Log Message" options.
- Clicking on the "NiMS Tunnel" icon will both tunnel the local debug session and generate an external public chrome-devtools URL which can be opened in the Chrome browser.
You'll notice that if you go back and forth between the VSCode debugger and Chrome DevTools that you should be able to use the debugger controls in each respective tool while they will stay in sync with one another through the program execution.
Congratulations, you've successfully used both VSCode and Chrome DevTools to begin debugging your Node.js code and you're on your way to an improved development experience!
Conclusion
Node.js debugging really is a simple and straightforward process. I've read that it may have been a headache in the past, but I think we've shown that the tools available today make it a breeze. Hopefully this post has shown you how to move away from using so many console.log statements in your code, or at least not for debugging purposes.
You might also enjoy reading about how to use the NiM Chrome Extension to further smooth your workflow.
NiM (Node --inspector Manager) is a Chrome Extension that manages the DevTools lifecycle while using node's built in debugger, similar to how we've done in this post. If your primary debugging flow involved using DevTools and not VSCode then NiM is likely a tool you'd find helpful.
The following post talks about using the tool, why my workflow broke, and how NiM actually helped fix it and make debugging node.js even cooler.